Visualizing corruption around the world
Growing levels of public sector corruption can stifle a country’s economic growth while also chipping away at political freedom.
Which parts of the world are perceived to be most corrupt – and further, how does this data differ between regions, and how has it trended over time?
The corruption perception index (CPI)
Today’s chart pulls its numbers from the recent 2018 Corruption Perceptions Index report, which has been published by Transparency International annually since 1995. The report scores 180 countries, and is considered the world’s most widely-used barometer for corruption.
However, before we dive in to the data, it’s worth taking a quick look at the methodology behind the report:
Methodology:
- The CPI attempts to measure perceptions about corruption in a country, rather than corruption itself
- Specifically, it is focused on the public sector of countries, which includes governments and government-run institutions
- The CPI is a composite index, using the results from 13 separate reports and surveys to calculate an overall score
- Scores range from 0 (most corrupt) to 100 (most clean)
Finally, it’s also worth noting that in the chart, we’ve added in government types as rated by the Economist Intelligence Unit – they range from “Full Democracy” to “Autocratic Regime”.
The most and least corrupt places
What do experts and businesspeople see as the most and least corrupt global regions?
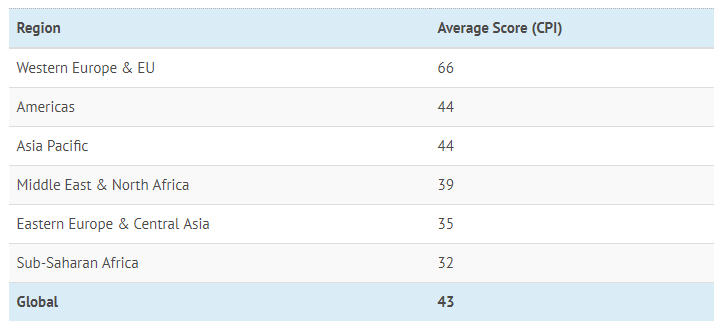
Western Europe has the highest score on average, while Sub-Saharan Africa has the lowest (most corrupt) average score. The Americas ranks just above the global average score of 43, mainly because the average is skewed by the lower scores of many countries in Latin America (such as Venezuela) and the Caribbean (such as Haiti).
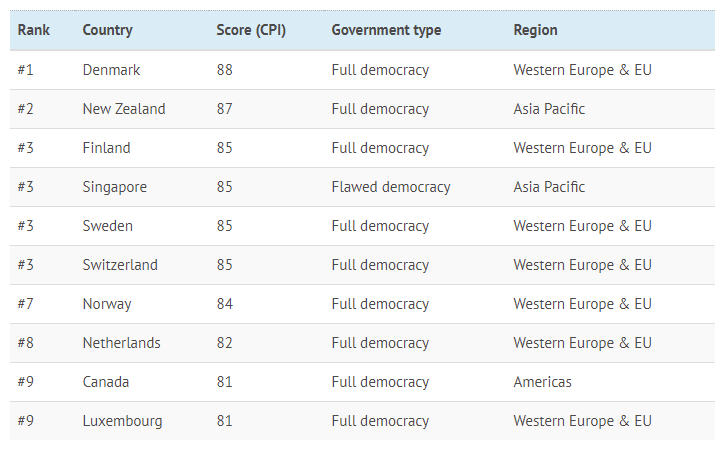
Now, let’s look at the top 10 countries overall:
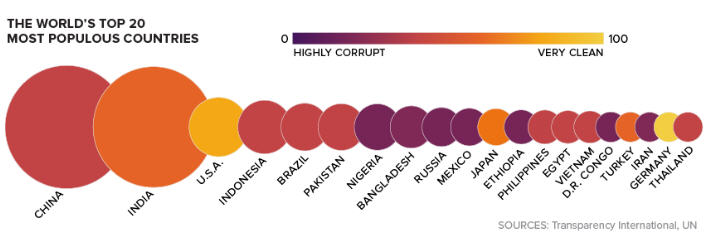
Here’s also a look at the world’s 20 most populous countries:
As the report notes, the relation between democracy and corruption appears to be quite clear: the more democratic a regime is, the less corrupt it is perceived to be. Using the Economist Intelligence Unit rankings, there are no “Hybrid” or “Autocratic” regimes that come anywhere near the top 10.
The closest may be the U.A.E. – which is classified as an Autocratic Regime – which has a CPI score of 70, good for 23rd place globally.
Trends over time
Over the last seven years, the report notes that there were a few specific countries that have consistently trended in one direction or another.
Hungary: The country has seen a -9 point change to its CPI score since 2012, dropping to 46 points in total. That’s just a notch above the global average.
Turkey: Turkey’s rating has deteriorated from 49 to 41 over the 2012-2018 time period.
Argentina: The South American nation has seen its score rise by eight points over the 2012-2018 time period.
Guyana: Guyana has gained nine points – a significant improvement over its original score of 28 at the start of that time period.
What will be the next country to jump up (or down) the list – and what factors will lead to this change in perception?
Note: The color-coding on the map has been updated to better reflect CPI scores.
(By Jeff Desjardins)

{{ commodity.name }}
{{ post.title }}
{{ post.date }}
Comments